Quick answer
- Each candlestick shows four prices—open, high, low and close—for one time period; the body marks the open-to-close range and the wicks mark the high and low.
- Read multiple candles left to right: rising closes with higher lows signal an uptrend, falling closes with lower highs signal a downtrend.
- Start with three to five patterns—hammer, engulfing, doji, morning star and evening star—and always confirm them against the broader trend and nearby support or resistance.
In this article
- What Is a Candlestick and What Do Its Parts Mean?
- How Do You Read Multiple Candlesticks on a Chart?
- Step-by-Step: Read Your First Candlestick Chart in 6 Steps
- Which Candlestick Patterns Should a Beginner Learn First?
- How Do Time Frames Change What You See on a Candlestick Chart?
- Common Mistakes When Reading Candlestick Charts
- Quick-Reference Checklist: Reading Any Candlestick Chart
- Frequently asked questions
What Is a Candlestick and What Do Its Parts Mean?
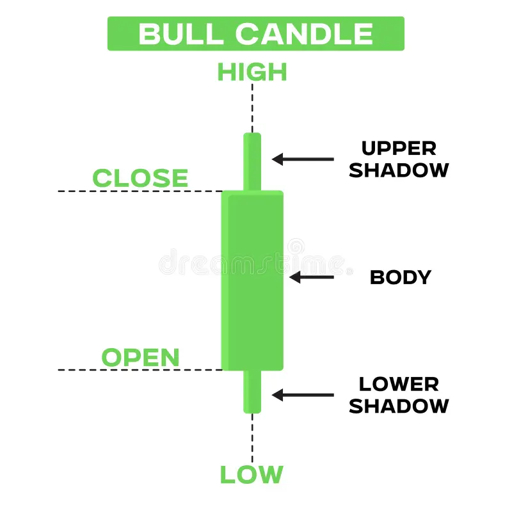
A candlestick is a visual summary of four price data points — open, high, low and close (OHLC) — for one time period on a chart. That period could be one minute, one hour, one day, or any other candlestick chart time frame your platform offers. Understanding what does a candlestick show starts with learning these four parts.
Every candlestick has two main components, and here is how the candlestick body and wick are explained:
- Body — the solid rectangle between the open and close prices. A tall body means price moved a lot between open and close; a thin body means it barely moved.
- Wicks (also called shadows) — the thin lines extending above and below the body. The upper wick tip marks the high (the highest price during that period). The lower wick tip marks the low (the lowest price).
The colour tells you direction. A bullish candlestick (usually green or white) means the close is above the open — buyers pushed price up. A bearish candlestick (usually red or black) means the close is below the open — sellers pushed price down.
A doji is a candle where the open and close are nearly identical, so the body is almost a flat line. It signals indecision: neither buyers nor sellers won that period. A doji alone is not a trade signal — it needs context from surrounding candles.
Example: Imagine a one-hour EUR/USD candle with open 1.1050, high 1.1085, low 1.1030, close 1.1070. The body stretches from 1.1050 (bottom of body) to 1.1070 (top of body) — a 20-pip range. The upper wick extends from 1.1070 to 1.1085 (15 pips above the body). The lower wick extends from 1.1050 down to 1.1030 (20 pips below the body). Because the close (1.1070) is above the open (1.1050), this is a bullish candle. To understand what each pip is worth in your account currency, use a pip value calculator.
Picture it like this: the upper wick tip = high (1.1085), top of body = close (1.1070), bottom of body = open (1.1050), lower wick tip = low (1.1030). On a bearish candle, the positions of open and close inside the body flip — the open sits at the top, the close at the bottom.
Common mistake: beginners often assume the top of the body is always the high of the candle. It is not. The top of the body is either the close (bullish) or the open (bearish). The actual high is always the tip of the upper wick. Misreading this leads traders to set stop-losses or targets at the wrong price.
How Do You Read Multiple Candlesticks on a Chart?
You read multiple candlesticks by scanning left to right and comparing each candle’s close to the one before it. Every candle on the chart represents one complete time period—one minute, one hour, one day, or whichever candlestick chart time frame you have selected. The newest candle sits on the far right.
Identifying the trend:
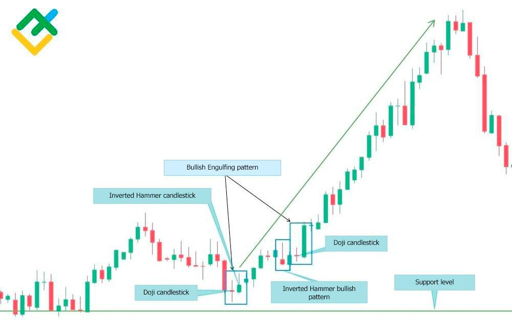
- Uptrend — a series of candles where each close is higher than the previous close, often forming “higher highs” and “higher lows.”
- Downtrend — a series of candles where each close is lower than the previous close, producing “lower highs” and “lower lows.”
- Sideways range — closes bounce between roughly the same high and low levels with no clear direction.
The relationship between consecutive candles matters more than any single candle. A bullish candle inside a strong downtrend does not automatically mean the trend has reversed; it may just be a pause.
Volume (the number of contracts or ticks traded during that period) confirms or weakens the story. A large bullish candle on high volume suggests strong buyer commitment. The same candle on thin volume is less reliable. Volume data is not always available on every forex platform, so check your chart settings.
Example: reading a five-candle daily sequence on EUR/USD.
| Candle | Open | High | Low | Close |
|---|---|---|---|---|
| 1 | 1.0800 | 1.0830 | 1.0785 | 1.0820 |
| 2 | 1.0820 | 1.0855 | 1.0810 | 1.0850 |
| 3 | 1.0850 | 1.0870 | 1.0835 | 1.0860 |
| 4 | 1.0860 | 1.0890 | 1.0845 | 1.0880 |
| 5 | 1.0880 | 1.0910 | 1.0870 | 1.0905 |
Each close is higher than the last (1.0820 → 1.0850 → 1.0860 → 1.0880 → 1.0905), and each low is higher than the previous low. That is a textbook uptrend across five candles—an 85-pip move from first open to last close.
Common mistake: reading one candle in isolation. A single bullish candle means little if the four candles before it all closed lower. Always zoom out and check the trend context before making a decision. If you plan to act on a setup, use a risk-to-reward calculator to confirm the trade is worth taking relative to your stop loss.
Step-by-Step: Read Your First Candlestick Chart in 6 Steps
- Choose your time frame. Each candlestick represents one unit of time—one minute, one hour, one day, and so on. Pick the candlestick chart time frame that matches how long you plan to hold a trade: the daily chart for swing trades lasting days, the 1-hour or 4-hour chart for intra-day setups. Why it matters: a bullish candle on a 5-minute chart can appear inside a bearish candle on the 1-hour chart, giving opposite signals. Common mistake: jumping between time frames without deciding which one is your primary view.
- Identify the overall trend direction. Scan the chart from left to right. If you see a staircase of higher highs and higher lows, the trend is up. Lower highs and lower lows mean the trend is down. Why it matters: patterns that agree with the trend succeed more often than patterns that fight it. Common mistake: zooming in so far that you only see the last few candles and miss the bigger trend.
- Read the most recent candle. Note three things: body size (large = strong conviction, small = indecision), colour (bullish or bearish), and wick length (long wicks show rejection of a price level). This is the core of what a candlestick shows. Common mistake: ignoring the wicks and focusing only on the body colour.
- Compare it to the previous two or three candles. A single candle means little on its own. Context from neighbouring candles tells you whether momentum is building, fading, or reversing. Common mistake: trading a candle in isolation without checking what came before it.
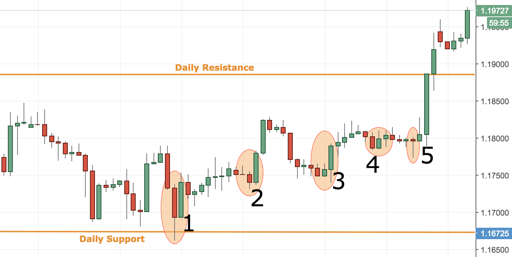
- Mark support and resistance. Support is a price level where buyers repeatedly step in; resistance is where sellers dominate. Look for zones where wicks cluster or where bodies consistently reverse direction. Common mistake: drawing a single thin line instead of a zone—price rarely turns at an exact number.
- Spot any recognisable pattern, then confirm. If you notice a common candlestick pattern for beginners—such as a hammer or engulfing candle—check that it aligns with the broader trend and sits near a support or resistance zone. Common mistake: acting on a pattern that forms in the middle of nowhere, away from any key level.
Open a demo chart and walk through these six steps on at least 20 historical candles before risking real money. Repetition builds the eye for reading candlestick charts far faster than memorising theory alone.
When you reach Step 5, knowing your exact risk per trade matters as much as reading the chart. Use a position size calculator to match your stop-loss distance to a sensible lot size.
Which Candlestick Patterns Should a Beginner Learn First?
Start with three to five common candlestick patterns for beginners rather than memorising an entire encyclopedia. A small set, learned deeply, beats a large set recognised vaguely.
Hammer and hanging man. Both are single candles with a small body near the top and a long lower wick (at least twice the body’s length). A hammer appears after a downtrend and hints that buyers stepped in, pushing price back up before the close. A hanging man looks identical but appears after an uptrend, warning that sellers briefly took control. The difference depends entirely on where the candle sits in the trend.
Engulfing pattern. This is a two-candle pattern where the second candle’s body fully covers the first candle’s body. A bullish engulfing at the bottom of a downtrend suggests buyers have overwhelmed sellers. A bearish engulfing at the top of an uptrend suggests the opposite—a momentum shift toward selling.
Doji. A doji forms when the open and close are nearly equal, leaving a very thin or invisible body. It signals market indecision. A doji is only meaningful when it appears at key support or resistance levels; in the middle of a range it tells you little.
Morning star and evening star. These are three-candle reversal patterns. A morning star combines a bearish candle, a small indecision candle (often a doji), and then a bullish candle—signalling a possible bottom. An evening star is the mirror image at a top.
| Pattern | Candles | Where It Appears | What It Suggests |
|---|---|---|---|
| Hammer | 1 | Bottom of downtrend | Possible bullish reversal |
| Hanging Man | 1 | Top of uptrend | Possible bearish reversal |
| Bullish Engulfing | 2 | Bottom of downtrend | Momentum shift to buyers |
| Bearish Engulfing | 2 | Top of uptrend | Momentum shift to sellers |
| Doji | 1 | Support or resistance | Indecision; wait for confirmation |
| Morning Star | 3 | Bottom of downtrend | Possible bullish reversal |
| Evening Star | 3 | Top of uptrend | Possible bearish reversal |
No pattern guarantees a move. Every pattern is a clue, not a command. Always check the broader trend and consider your risk-to-reward ratio before entering a trade.
Common mistake: spending weeks memorising dozens of exotic patterns while skipping basic chart-reading skills like identifying the trend and marking support and resistance. Master the patterns above first; add new ones only after you can spot these reliably in live charts.
How Do Time Frames Change What You See on a Candlestick Chart?
The time frame you choose controls how much price history each candlestick holds, so the same market can look bullish on one chart and bearish on another. A time frame is simply the period each candle represents—five minutes, one hour, four hours, daily, weekly, and so on.
Shorter candlestick chart time frames (like 5-minute or 15-minute) pack more candles onto your screen. That extra detail also brings more noise—small, random-looking moves that can trick you into seeing patterns that mean nothing on a larger scale. Longer time frames smooth the picture because each candle absorbs more price action, but they react slower to changes.
Example: Suppose EUR/USD opens Monday at 1.0800, drops to 1.0760 mid-morning, rallies to 1.0830 in the afternoon, then closes at 1.0820. On the daily chart you see one bullish candle—open 1.0800, close 1.0820, a 20-pip green body with a lower wick down to 1.0760 and a tiny upper wick to 1.0830. Now switch to the 4-hour chart. That same day splits into six candles. The first two might be red (bearish), showing the drop to 1.0760. The next three could be green (bullish), capturing the rally. The sixth might be a small-bodied candle showing hesitation. A beginner reading only the 4-hour chart could spot a “bearish engulfing” early in the day and sell—right before the market reversed upward.
This is why a bullish pattern on a 15-minute chart can be meaningless if the daily chart shows a strong downtrend. Always check the higher time frame first to understand the overall structure, then zoom in for timing.
A common trap is time-frame hopping—jumping between charts looking for a signal that confirms what you want to do. Pick one or two time frames and stick with them. Most beginners benefit from starting with the daily chart to learn how to read forex candlestick patterns before moving to shorter views.
Common Mistakes When Reading Candlestick Charts
Most losses from candlestick reading come not from picking the wrong pattern but from skipping the context around it. Here are the five mistakes beginners make most often.
- Trading a pattern without checking trend direction. A hammer (a bullish reversal candle) that forms in the middle of a strong downtrend with no support level nearby is far less reliable than one that appears right at a well-tested support zone. Entering the trade anyway often means buying into selling momentum that simply continues.
- Ignoring the wicks. The wick—the thin line above or below the body—shows where price travelled but could not stay. A long upper wick means buyers pushed price up and sellers rejected it; a long lower wick means sellers pushed price down and buyers rejected it. Skipping this information hides the most direct clue about who is winning the fight between buyers and sellers, which is central to understanding what a candlestick shows.
- Confusing correlation with causation. A pattern appearing on the chart does not force price to move in any direction. Candlestick patterns describe what happened in a set period; they are not guarantees of what comes next. Treating them as certainties leads to oversized positions and unnecessary losses.
- Using candlestick patterns alone. A bullish engulfing candle is stronger when it forms at a support level, aligns with the higher time-frame trend, or coincides with rising volume. Without at least one extra piece of confluence, you are essentially flipping a coin. Before sizing a trade, run the numbers through a position size calculator so a single wrong read does not blow your account.
- Over-optimising on historical data. Scrolling back through charts and circling every pattern that “worked” creates a false sense of accuracy. This is called back-fitting. Live markets include slippage, spread widening, and news spikes that neat historical screenshots do not capture, so real-world win rates are always lower than what back-testing suggests.
None of these mistakes means candlestick charts are useless. They mean candlestick reading is a skill that works best when combined with trend analysis, key levels, and disciplined risk management.
Quick-Reference Checklist: Reading Any Candlestick Chart
Use this checklist every time you open a candlestick chart so you read it the same way, with the same discipline, regardless of the pair or session.
- Confirm your time frame. Know exactly what each candle represents — one minute, one hour, one day. A long bullish candle on a 1-minute chart carries far less weight than the same candle on a daily chart because candlestick chart time frames change the significance of every signal.
- Identify the trend first. Before studying any single candle, zoom out and ask: is price making higher highs (uptrend), lower lows (downtrend), or moving sideways? A pattern that appears against the trend has a lower probability of working.
- Read the latest candle’s body and wicks. Check three things: body colour (bullish or bearish), body size (strong or weak momentum), and wick lengths (rejection of higher or lower prices). This is the core of what a candlestick shows.
- Compare to surrounding candles. A single candle means little on its own. Look left: does the current candle confirm or contradict the previous two to five candles? This comparison is how you spot common candlestick patterns for beginners, like engulfing or inside-bar setups.
- Check for support and resistance nearby. Support is a price level where buyers have previously stepped in; resistance is where sellers have pushed price down. A pattern forming right at one of these levels is more meaningful than the same pattern in open space.
- Never act without a plan. Decide your stop-loss (the price at which you exit if wrong) and your position size before you place a trade. Reading the chart is analysis, not a trade signal — you still need a clear risk plan.
Print or screenshot this list and keep it beside your trading screen. Run through every item in order; skipping even one step is where most misreads — and most losses — begin.
Frequently asked questions
What is the difference between a candlestick chart and a bar chart?
Both display the same open, high, low and close data for each time period. A bar chart uses a vertical line with small horizontal ticks for open and close, while a candlestick uses a coloured body that makes the open-to-close range instantly visible. Most beginners find candlesticks easier to scan quickly.
Does the colour of a candlestick always mean the same thing on every platform?
The meaning stays the same—bullish means close above open, bearish means close below open—but platforms let you customise the colours. Green and red are common defaults; others use white and black. Always check your chart settings so you know which colour represents which direction on your specific platform.
How many candlestick patterns do I need to memorise to start trading?
Three to five patterns are enough to begin: hammer, engulfing, doji, morning star and evening star. Learning a small set deeply is more effective than memorising dozens you cannot reliably spot. The main risk is acting on a pattern without checking the overall trend and nearby support or resistance levels.
Can I use candlestick charts for crypto and stocks or only forex?
Candlestick charts work for any market that provides open, high, low and close data—forex, stocks, crypto, commodities and indices. The reading method is identical across all these markets. The main caveat is that volume data, which helps confirm candle signals, may not be available or reliable on every platform.
Risk warning: Forex and CFD trading carries a high risk of losing money and is not suitable for everyone. This article is for education only and is not financial advice. Never trade money you cannot afford to lose.